Abstract
Polycystic Ovarian Syndrome (PCOS) is a disorder caused due to endocrine dysfunction, that affects women of reproductive age. Although the aetiology of PCOS isn’t known, patients diagnosed with PCOS are generally found to exhibit elevated levels of the androgen and lower levels of progesterone.
In order to understand the pathophysiology of PCOS, we have explored PCOS gene expression data comprising 9 datasets from the NCBI GEO database. We have used unsupervised linear dimensionality reduction techniques such as Principal Component Analysis (PCA), Independent Component Analysis (ICA) & Non-negative Matrix Factorization and non-linear dimensionality reduction techniques such as Variational Auto Encoders (VAE) & Denoising Auto Encoders (DAE) to extract biologically important signals from the data. The VAE network was trained using the binary cross-entropy loss func- tion coupled with a Kullback-Leibler divergence penalty, while the DAE network was trained using a MSE cost function.
Our model has identified 5 genes - FAM163A, FOLR2, S100A6, AKR1A1 and MCL1, that correspond to the latent dimensions that maximally separate the PCOS data points from the control data points. These genes were found to participate in key pathways related to PCOS such as insulin secretion, vitamin and mineral absorption, insulin resistance, androgen and prostaglandins productions. Additionally, we also worked on understanding the ability of the different dimensionality reduction algorithms in identifying key features in the biological data, their stability and the similarity in the features identified by each algorithm across different latent dimensions.
Motivation
1. Why gene expression?
Most cells in a given organism contain the same set of genes, but only a select set of these genes are expressed at any given time. This gene expression is a highly regulated process. When cellular systems are perturbed, changes in the biological processes reflect on the gene expression data.
Gene expression analysis involves studying the behavior and functioning of individual genes in an organism, by analyzing their gene expression (mRNA) levels. The dynamic functional view provided by gene expression analysis enables us to acquire a better understanding of individual genes, gene networks and biological pathways. This in turn proves very useful in understanding the pathophysiology of diseases, analyzing the effects of mutations, evaluating the efficiency of drugs, and so on. However, due to the enormity of the gene expression data and the large number of parameters that need to be estimated in the process, direct analysis of the data is both tedious and computationally intensive. Hence, many gene expression analysis studies make use of dimensionality reduction methods, such as Principal Component Analysis (PCA), before analyzing the gene expression data.
2. Dimensionality Reduction and Retransformations
However, deriving insights from the latent (transformed) space alone, is difficult due to the limitations imposed by the transformation. Additionally, we need to decode the latent space representation back to the original space in order to completely understand the biological significance. Unsupervised neural network based approaches, such as autoencoders, can help deal with these shortcomings, by performing both dimensionality reduction (encoding) and decoding. Recent works such as employ Denoising Autoencoders (DAEs), while the works of explore Variational Autoencoders (VAEs). Depending on the algorithm used and the range of latent space dimensionalities explored, different kinds of biological patterns can be captured.
In our study, we have focused on analyzing gene expression data of PCOS patients as well as non-PCOS controls, in order to infer biological patterns associated with PCOS, by applying unsupervised dimensionality reduction techniques, including Principal Component Analysis (PCA), Independent Component Analysis (ICA), Non-negative Matrix Factorization (NMF), Denoising Autoencoders (DAEs) and Variational Autoencoders (VAEs), across different latent dimensional representations.
Methods
1. Pre-Processing
All the gene expression data used in our study was obtained from NCBI GEO. A total of 9 datasets related to PCOS was available on GEO. The gene expression datasets and the associated annotation files were accessed and parsed programmatically from the search result.
The gene expression levels for each dataset was extracted from their respective SOFT files and the mapping between the gene IDs used in the dataset and their Entrez Gene IDs was extracted from their respective annotation files. The distribution of the genes (i.e.) Normal/Control, PCOS or after drug application was extracted from the Sample Subset tab of each dataset.
2. Models
Linear dimensionality reduction techniques
The linear dimensionality reduction techniques used are as follows:
- Principal Component Analysis (PCA): PCA identifies linear directions along which the variance of the data is maximum. The directions are then arranged based on the decreasing order of variance. The data is then projected onto the reduced set of directions.
- Independent Component Analysis (ICA): The dimensionality reduction done by ICA is very similar to that of PCA, but, it makes a key assumption that the latent dimensions are mutually independent and non-Gaussian. It is like a rotation of PCA.
- Non-negative Matrix Factorization (NMF): NMF dimensionality reduction is used on samples that have non-negative values. The coefficients in the linear combination of the initial data are necessarily non-negative. Hence, the dimensions that don’t contribute to the latent dimensions have a zero coefficient.
Non-linear dimensionality reduction techniques
Autoencoders are unsupervised deep neural networks, which comprise of three main parts: an encoder that performs dimensionality reduction on the input data, one or more hidden layer(s) which capture the latent or hidden representations, and a decoder that decodes the latent dimensional representation back to the original dimension, as the output.
- Variational Autoencoders (VAE): VAEs are stochastic autoencoding frameworks. The hidden layers in a VAE learn and take into account both the mean and the variance of the data. The decoder then samples from this distribution generator (with variations) to produce the output.
- Denoising Autoencoders (DAE): In a DAE, some random noise is deliberately added to the input data, and the network is trained so as to remove the noise and capture the relevant signals.
Results
1. Strongly Associated Dimensions
The strongly associated components are the components that led to a sudden increase in the features captured from the data by the algorithm. In order to identify the strongly associated dimensions, we have used the correlation between the input data and the reconstructed data from the latent dimensions.
The results for linear dimensionality reduction models are as follows:
Figure 1: Correlation between the input and the reconstructed output across different linear algorithm and different latent dimensions.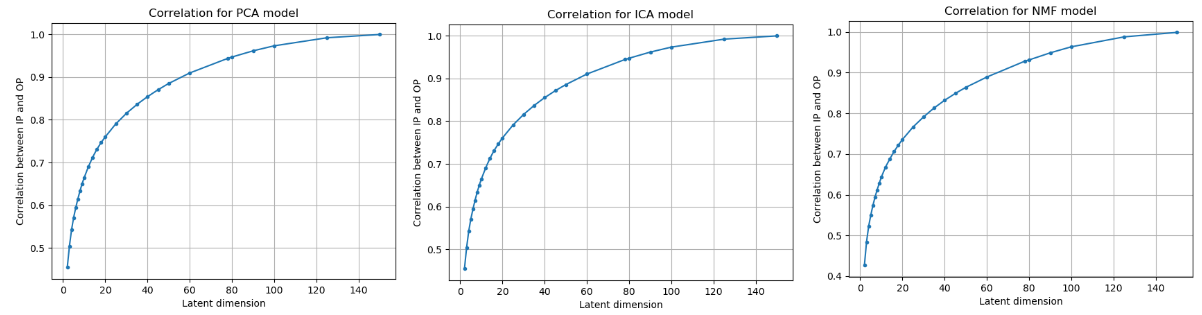
The correlation gains obtained after the addition of a new latent dimension is as follows:
Figure 2: Correlation gain observed across different algorithms and different latent dimensions.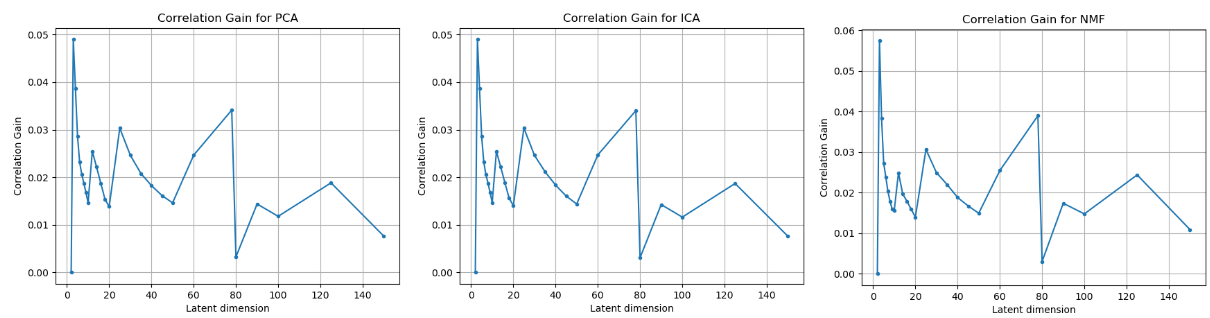
The results for non-linear dimensionality reduction models are as follows:
Figure 3: Correlation between the input and the reconstructed output across different linear algorithm and different latent dimensions.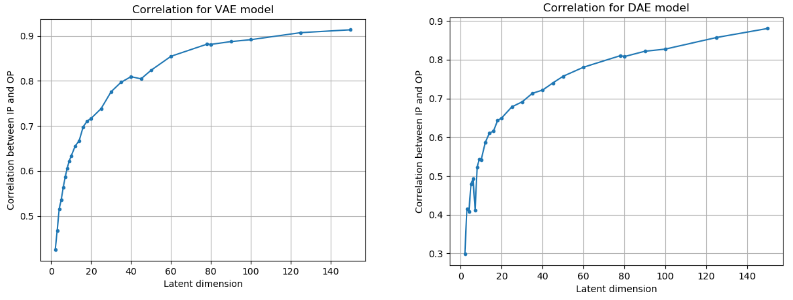
The correlation gains obtained after the addition of a new latent dimension is as follows:
Figure 4: Correlation gain observed across different algorithms and different latent dimensions.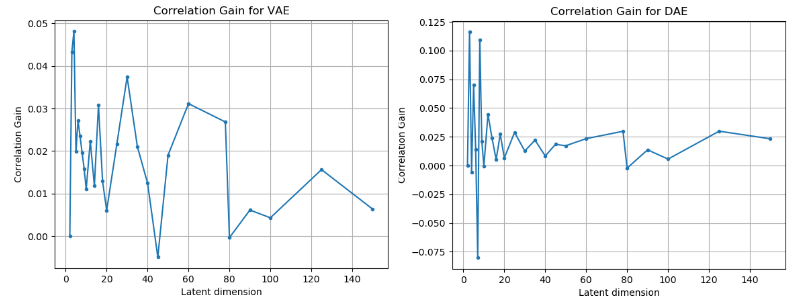
From the figures above, we can clearly see that the latent dimension 3 causes the maximum gain in correlation.
2. Gene Identification
Tailed t-tests were performed by comparing the weights for PCOS vs Control samples to identify the gene ID, latent dimensionality and model combination which gives maximum separation between the two sets. The results obtained are as follows:
| Model | Gene ID | Latent Dimension | − log 10 (P) | Tissues most expressed in |
|---|---|---|---|---|
| PCA | 148753 | 30 | 5.665 | Testis, Adrenal, Gall bladder |
| ICA | 2350 | 40 | 4.677 | Placenta, Gall bladder, Urinary bladder |
| NMF | 6277 | 60 | 2.450 | Colon, Lung, Stomach |
| DAE | 10327 | 2 | 1.747 | Kidney, Duodenum, Small intestine |
| VAE | 4170 | 5 | 1.879 | Bone marrow, Gall bladder, Appendix |
From the above table and figure, we can observe that PCOS vs Control samples were best separated by PCA, with respect to gene ID 148753, in latent dimension 30, with over-expression of the gene in the PCOS samples. This gene ID corresponds to Family with sequence similarity 163 member A. This gene has a biased expression in human tissues such as testis, adrenal and gall bladder.
PCOS vs Control samples were also well-separated by ICA, with respect to gene ID 2350, in latent dimension 40. This gene ID corresponds to folate receptor beta. This gene has a broad expression in human tissues such as placenta, gall bladder and urinary bladder.
For the PCA, ICA and NMF models, we observe a general increase in the − log 10 (P ) values (with fluctuations) as the number of latent dimensions increase. However, for the DAE and VAE, we can see an overall decreasing trend in the − log 10 (P ) values as the number of latent dimensions increase. This indicates that PCA, ICA and NMF are able to better distinguish between PCOS and Control samples at relatively higher latent dimensionalities, but DAE and VAE are able to capture this difference better at lower latent dimensionalities.
3. Biological Interpretation
From the results obtained above, it is interesting to note that our model is able to identify the following genes - FAM163A, FOLR2, S100A6, AKR1A1 and MCL1, that correspond to the latent dimensions that maximally separate the PCOS data points from the control data points. Out of these 5 genes, we got literature evidence for the role of the following genes - FOLR2, S100A6 in PCOS.
The gene FOLR2 (Gene ID 2350), is known to code for the protein - folate receptor beta. The folate receptor beta protein is known to play a key role in the pathways associated with vitamin digestion and absorption. Perturbations of this pathway, results in low folate production, affecting the utilization of Vitamin B12 and other B vitamins. This in turn affects the extent of the maturation egg released during ovulation. Incomplete maturation, prevents the ovaries from releasing adequate amount of progesterone that is essential in maintaining normal menstrual cycle in women.
Additionally, vitamin B12 deficiency is also associated with insulin resistance and obesity. The high levels of insulin in the blood results in enhanced production of androgen by the theca cells. This starts a cascade of actions affecting the progesterone levels, extent of maturation of the eggs. This role of folic acid in insulin resistance and PCOS has been further ratified here.
The gene S100A6 (Gene ID 6277) is also known to code for the S100 Calcium binding protein. This protein is known to play a key role in the stimulation of calcium dependent insulin release and prolactin secretion. They are also known to participate in the estrous cycle.
Conclusion
We analyzed gene expression data of PCOS patients as well as non-PCOS controls using unsupervised dimensionality reduction techniques such as PCA, ICA, NMF, DAE and VAE, across a range of different latent dimensions. We found that the different models in different latent dimensional representations were able to extract interesting biological patterns about the pathophysiology of PCOS, such as the folate receptor gene and the S100 Calcium binding protein. Hence, we concluded that, in order to derive new and meaningful insights into bio- logical data from gene expression analysis, it is essential to explore different dimensionality reduction algorithms as well as latent dimensions.
Share:-
-
-
-
-